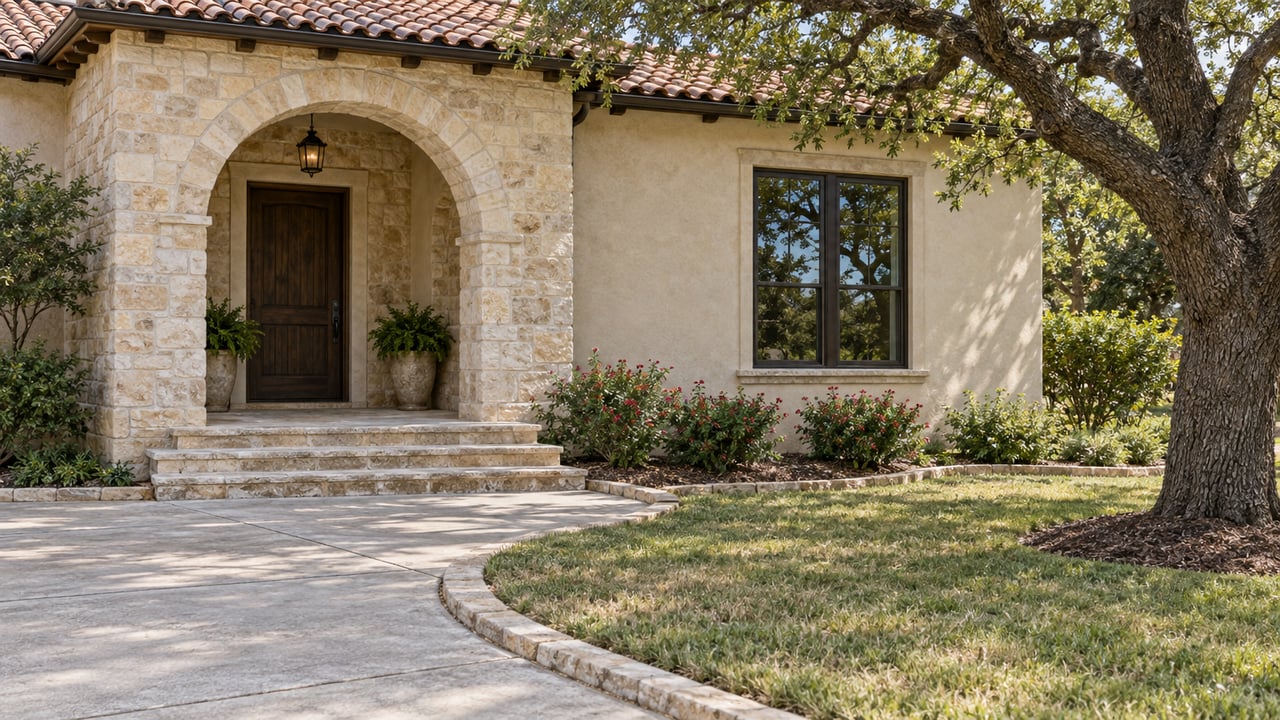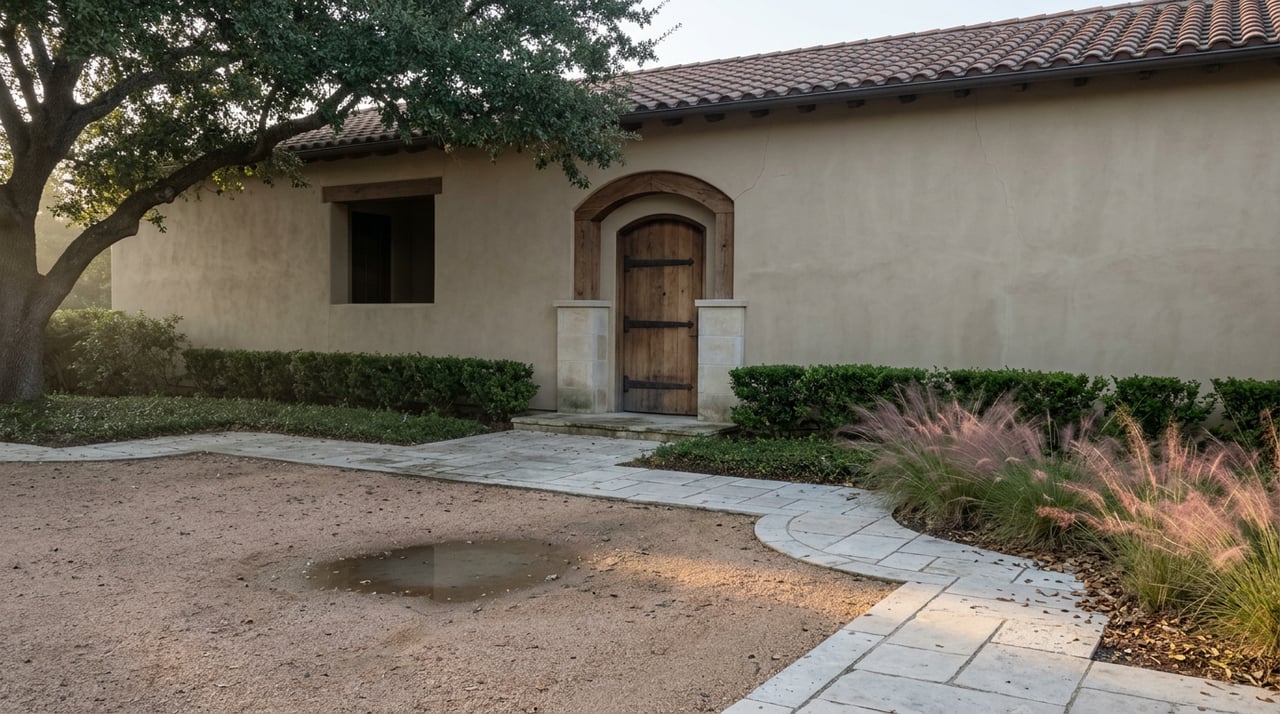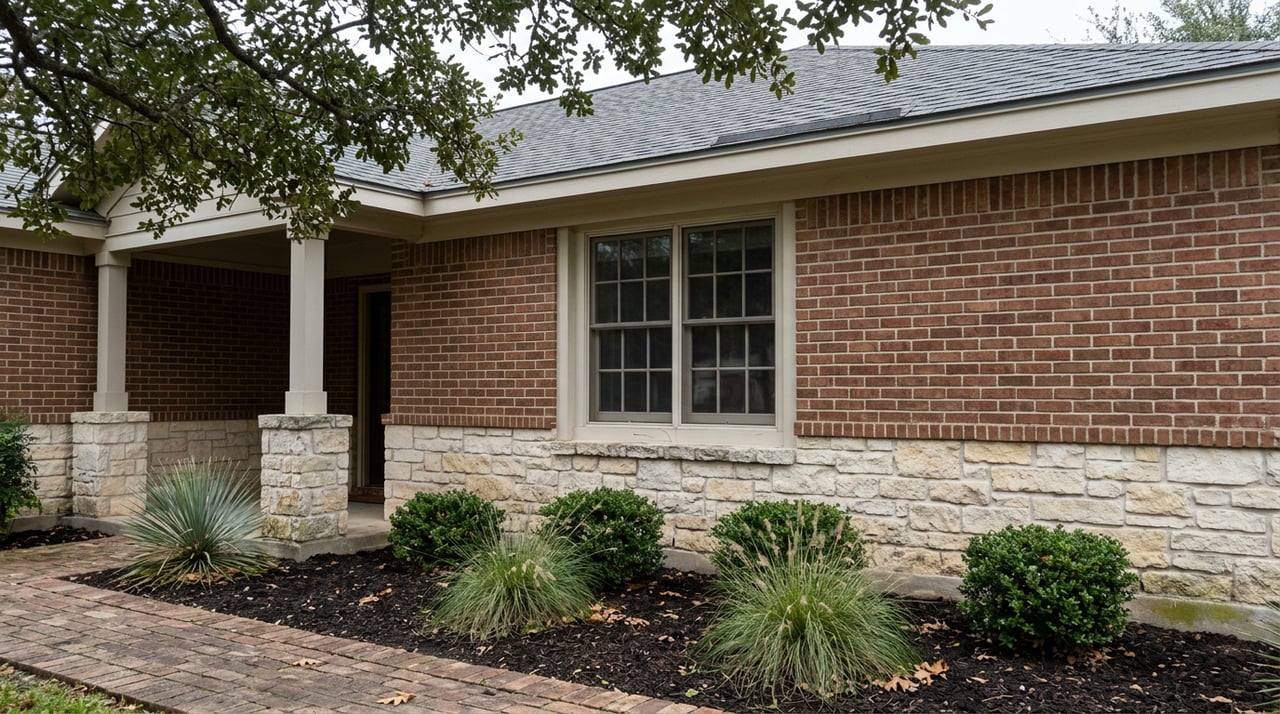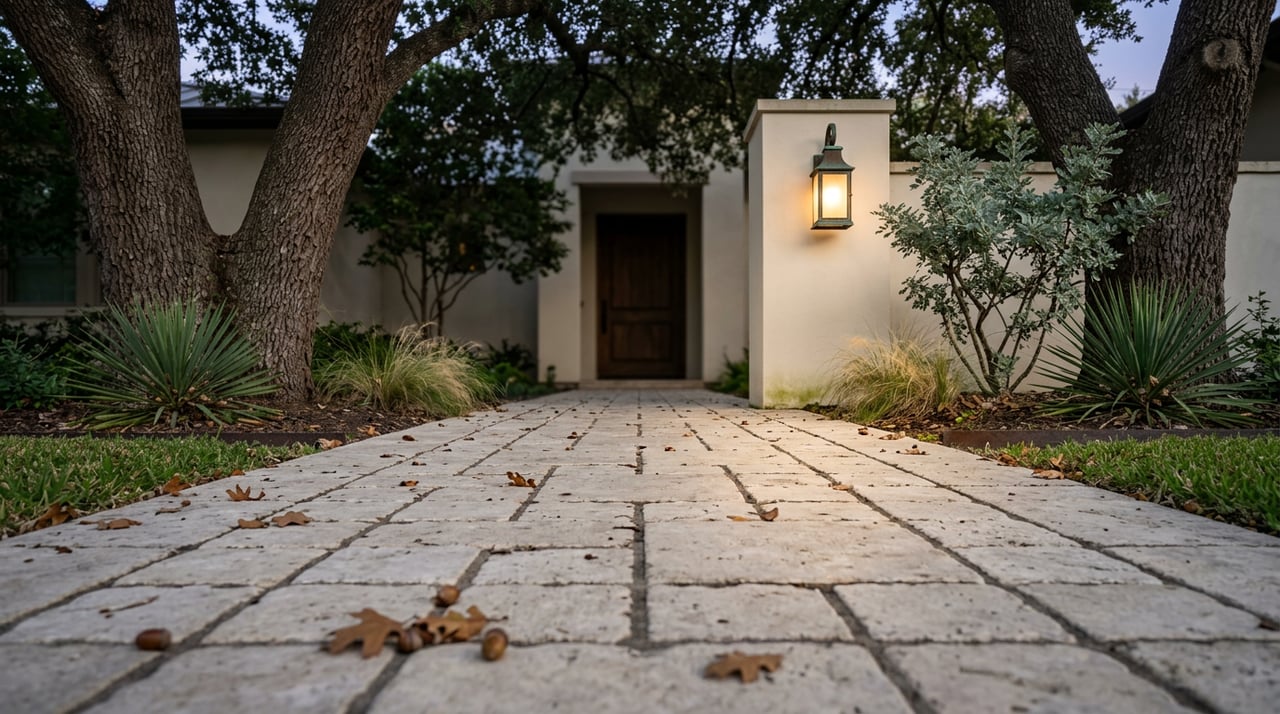
Pull up Stone Oak's home value on three different sites in the same afternoon and you will get three different numbers. Zillow's index put the average home value at $450,140 as of late July 2026, up a modest 0.8% over the year. Redfin's most recent monthly snapshot showed an average house price of $498K, up 11.9% year over year. A separate 30-day tracker showed a median closer to $521,500. Same ZIP code, same general stretch of North San Antonio, and a $70,000 spread depending on which tab is open.
That gap is not a data error. It is what happens when four structurally different housing markets get filed under one neighborhood name, and every tracker samples a slightly different mix of them in a given month.
Three Tabs, Three Numbers
Each of those figures is measuring something slightly different. Zillow's number is a smoothed home-value index built from estimated values across the whole area, which is why it moves slowly and shows the mildest year-over-year change. Redfin's monthly average and the 30-day median are both built from actual closed sales, which means they shift with whatever happened to sell that particular month. If a cluster of $1.1 million Sonterra estates closes in one 30-day window and a run of $420,000 Stone Oak Estates resales closes in the next, the median will swing by six figures without a single home in the neighborhood actually changing in value.
The same 30-day tracker that showed the $521,500 median also showed 188 homes on the market, up 14.6% from a year earlier, alongside a median of 14.5 days on market, down from 17 days the year before. Those two facts sitting next to each other, more inventory and faster median turnover, only make sense once you stop treating "Stone Oak" as one pool of homes competing against each other.
Four Neighborhoods Under One Name
Stone Oak is really a handful of subdivisions built at different times, at different elevations, with different HOA structures, that all share the same address prefix and school marketing.
| Subdivision | Typical price band | What defines it |
|---|---|---|
| Stone Oak Estates | $400,000–$600,000 | The original section, mostly 1998–2005 construction, mature trees, owners who have often been in place 15 to 20 years |
| The Heights at Stone Oak | $475,000–$700,000 | Higher terrain, newer builds, buyers trading an older Stone Oak floor plan for a more current layout at a similar price point |
| Sonterra | $650,000–$1.2M+ | Gated, golf-course, controlled access, the neighborhood's luxury tier |
| Northern-edge streets | Varies | Zoned to Comal ISD rather than North East ISD, a boundary that isn't visible from the curb |
A buyer comparing "a Stone Oak house" against "a Stone Oak house" without knowing which of these four they are actually looking at is comparing a 2001 resale on a mature quarter-acre lot to a gated golf-course estate, and wondering why the price-per-square-foot numbers do not line up.
The Heights Is Moving on Its Own Clock
The clearest proof that these submarkets do not move together sits in The Heights at Stone Oak specifically. Over the three months ending March 2026, homes there sold for a median of $475,000, down 13.6% from the same period a year earlier, and were taking 83 days to sell on average compared with 65 days the year before. During roughly that same window, the broader Stone Oak figures from other trackers were flat to positive, not falling.
That divergence is not a contradiction to explain away. It is the mechanism itself. A newer subdivision built on higher ground, competing against a wave of new-construction inventory nearby, can soften in price even while the overall neighborhood average holds steady, because the average is being propped up by activity somewhere else in Stone Oak entirely. A buyer using "Stone Oak is up 2.8%" as their negotiating baseline in The Heights specifically would be working from the wrong comparison set.
One Median Days on Market, Two Very Different Markets
The days-on-market numbers tell a similar story once you separate them by tier. The most recent 30-day snapshot showed a median of 14.5 days, faster than the 17 days recorded the year before, alongside 188 active listings and 38.89% of those listings carrying at least one price drop. A separate current reading put the average closer to 93.5 days, in a market Redfin scored just 38 out of 100 for competitiveness. Back in December 2025, that same average sat at 94 days, well above the 58 days recorded the December before.
Both are accurate. They are describing different slices of the same neighborhood. Entry-tier and correctly priced homes, the kind that make up much of Stone Oak Estates, are still moving in roughly two weeks. Move-up and luxury inventory, concentrated more heavily in The Heights and Sonterra, is sitting for three months at a time and absorbing price reductions along the way. A single "median days on market" for Stone Oak averages a two-week market with a three-month one and reports back a number that describes neither.
For a seller, this matters directly. Pricing a Stone Oak Estates resale as if it competes in the same tier as a Sonterra listing invites the exact price-cut cycle showing up in that 38.89% figure. Pricing it in line with what similar homes in its own subdivision have actually closed for, rather than the blended neighborhood median, is what keeps a listing out of that slower-moving bucket.
The Boundary That Doesn't Show Up on a Listing Photo
Most of Stone Oak is served by North East ISD, through Reagan and Johnson High Schools, both long-established campuses. But a slice of streets along the neighborhood's northern edge falls into Comal ISD instead, a distinction that has nothing to do with how a house looks from the driveway and everything to do with its exact address.
This is the kind of detail that only surfaces during a transaction, not during a drive-by. Two homes on visually similar streets, priced similarly, built by the same builder in the same year, can be zoned to different districts. That boundary can factor into resale comparisons down the line, since buyers searching by district will not see a home zoned outside their target district even if it sits inside the Stone Oak footprint they were picturing. Confirming exact zoning by address, not by neighborhood name, is a five-minute check that avoids a much larger surprise later.
What This Means When You're Actually Comparing Homes
None of this means Stone Oak's median price is meaningless. It means the median is a starting point, not a comparison tool. The useful question is never "what did Stone Oak sell for last month." It's which of the four Stone Oaks a specific listing belongs to, what similar homes in that specific subdivision have closed for recently, and whether that listing has already absorbed a price cut or is still testing the top of its range.
Frequently Asked Questions
Is all of Stone Oak zoned to North East ISD? Most of it is, but a portion of streets along the northern edge fall into Comal ISD instead. Zoning should always be confirmed by the specific property address rather than assumed from the neighborhood name.
Why do different home value sites show different Stone Oak prices? They measure different things. Index-based tools like Zillow's ZHVI smooth values across many properties and move slowly. Sites reporting median or average sale prices reflect whatever mix of homes actually closed in that specific window, which shifts month to month depending on which subdivision had activity.
Is Stone Oak a buyer's market or a seller's market right now? Both, depending on the tier. Recent snapshots show faster turnover and lower price cuts at the entry end of the range, alongside longer market times and more frequent price reductions in the move-up and luxury segments.
If you're comparing a specific Stone Oak listing against what similar homes in that exact subdivision have actually sold for, that's the kind of comparison worth getting right before you write an offer or set a list price. Jacob Rocha can pull that subdivision-level comparison for you and walk through what it means for your specific timeline. Let's Connect.